
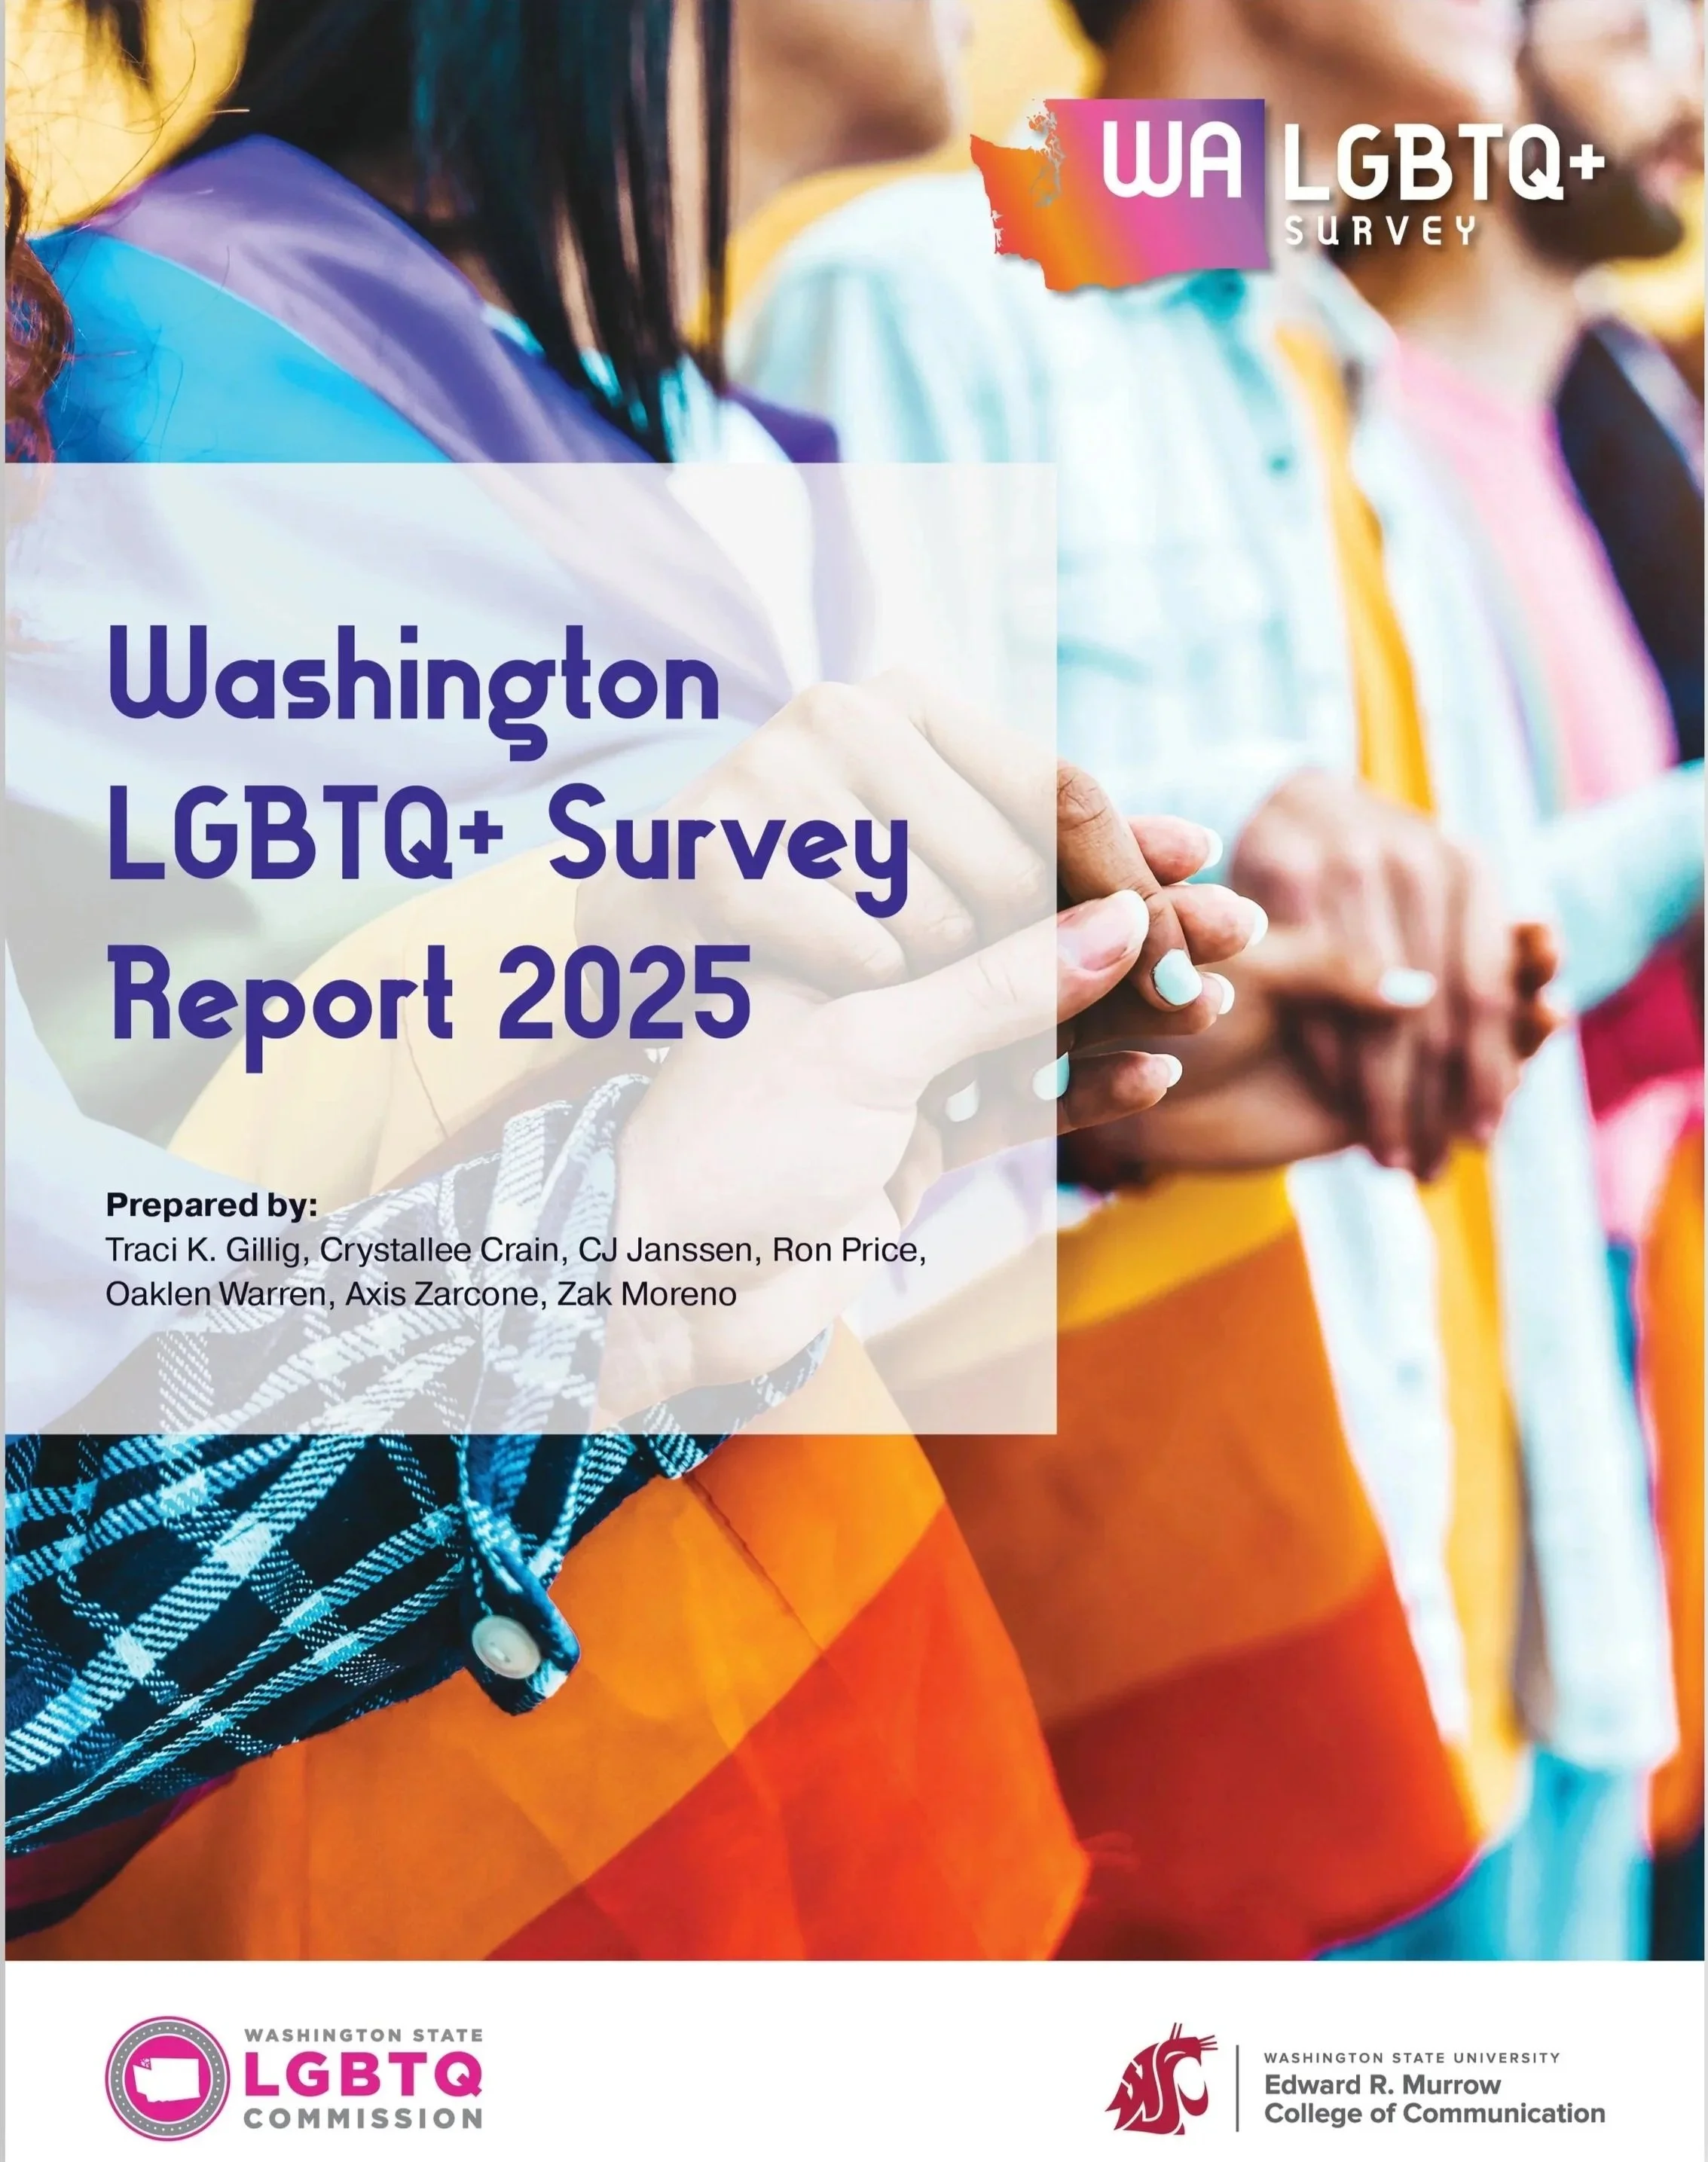
Washington LGBTQ+
Survey Report 2025
Academic Report
CLIENT
Washington State University & Washington State LGBTQ Commission
CREDIT
Art Direction & Design - Charles Watson II
Summary
In 2024, a groundbreaking statewide survey was conducted to gain a comprehensive understanding of the characteristics and experiences of LGBTQ+ individuals in Washington State. I worked with WSU and Washington State LGTBQ Commission to gather all of their findings and construct a 180 page report.
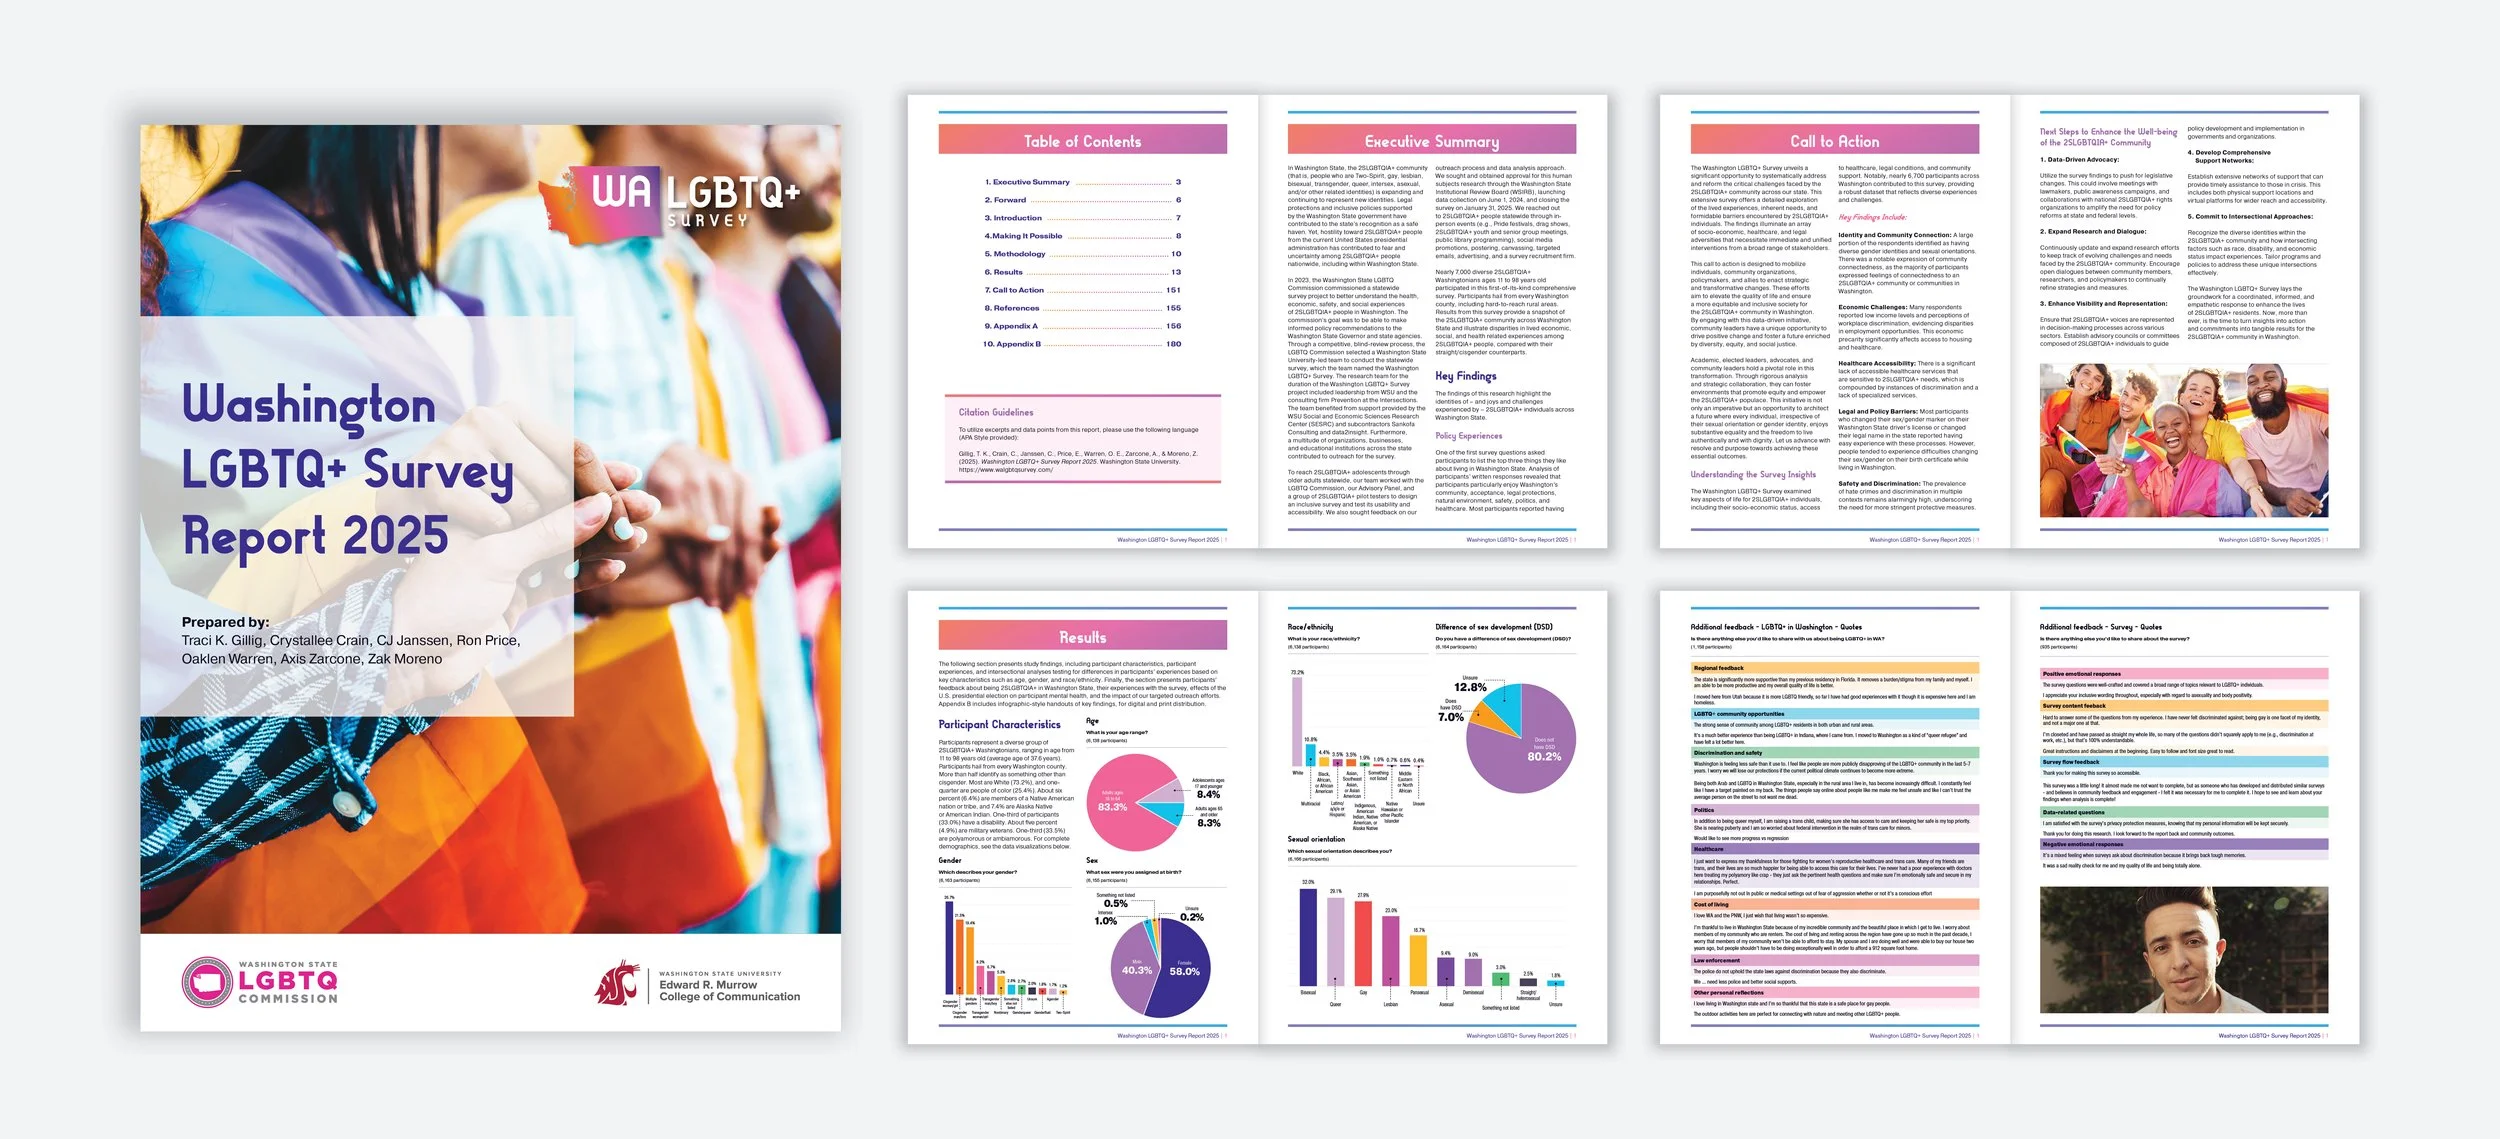
The project began by defining its purpose, scope, and key deliverables. Because the report would inform policy recommendations for the Office of the Governor and the Washington State Legislature, accessibility became a primary design objective. The final publication needed to support efficient review by commission members while remaining clear and approachable for the broader public.
The survey team collected extensive data from Washington's LGBTQ community, resulting in more than 225 charts and graphs to be designed. I began by analyzing the Excel datasets and accompanying Word documents to identify the most effective visualization for each data point, prioritizing clarity, accuracy, and accessibility. As I reviewed the findings, recurring themes emerged that naturally informed the report's information architecture, allowing related data to be grouped into consistent visual categories. This approach created a clear narrative throughout the report, making complex findings easier to interpret and compare.
The Process
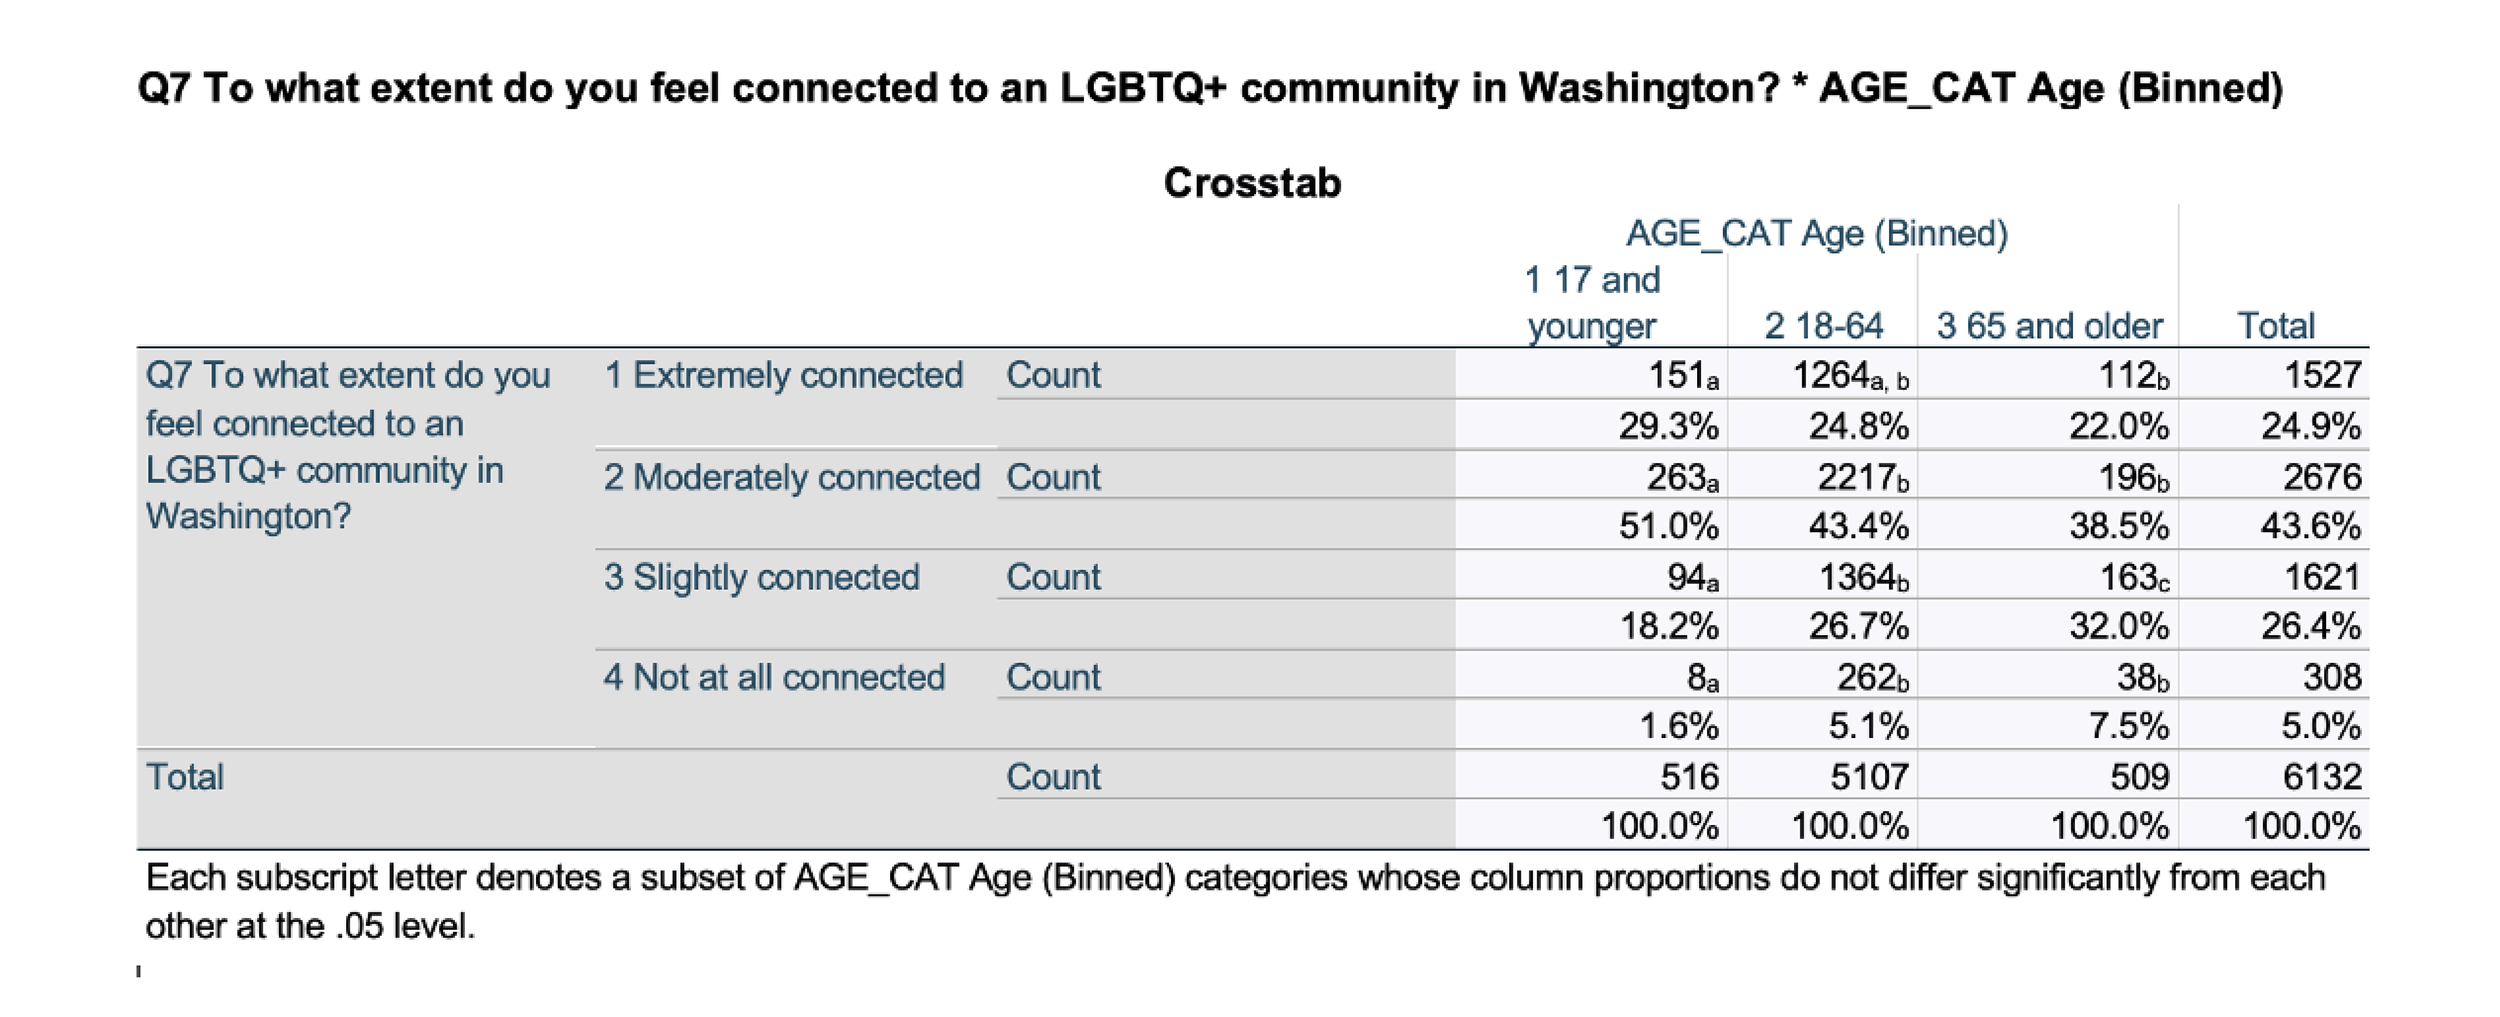
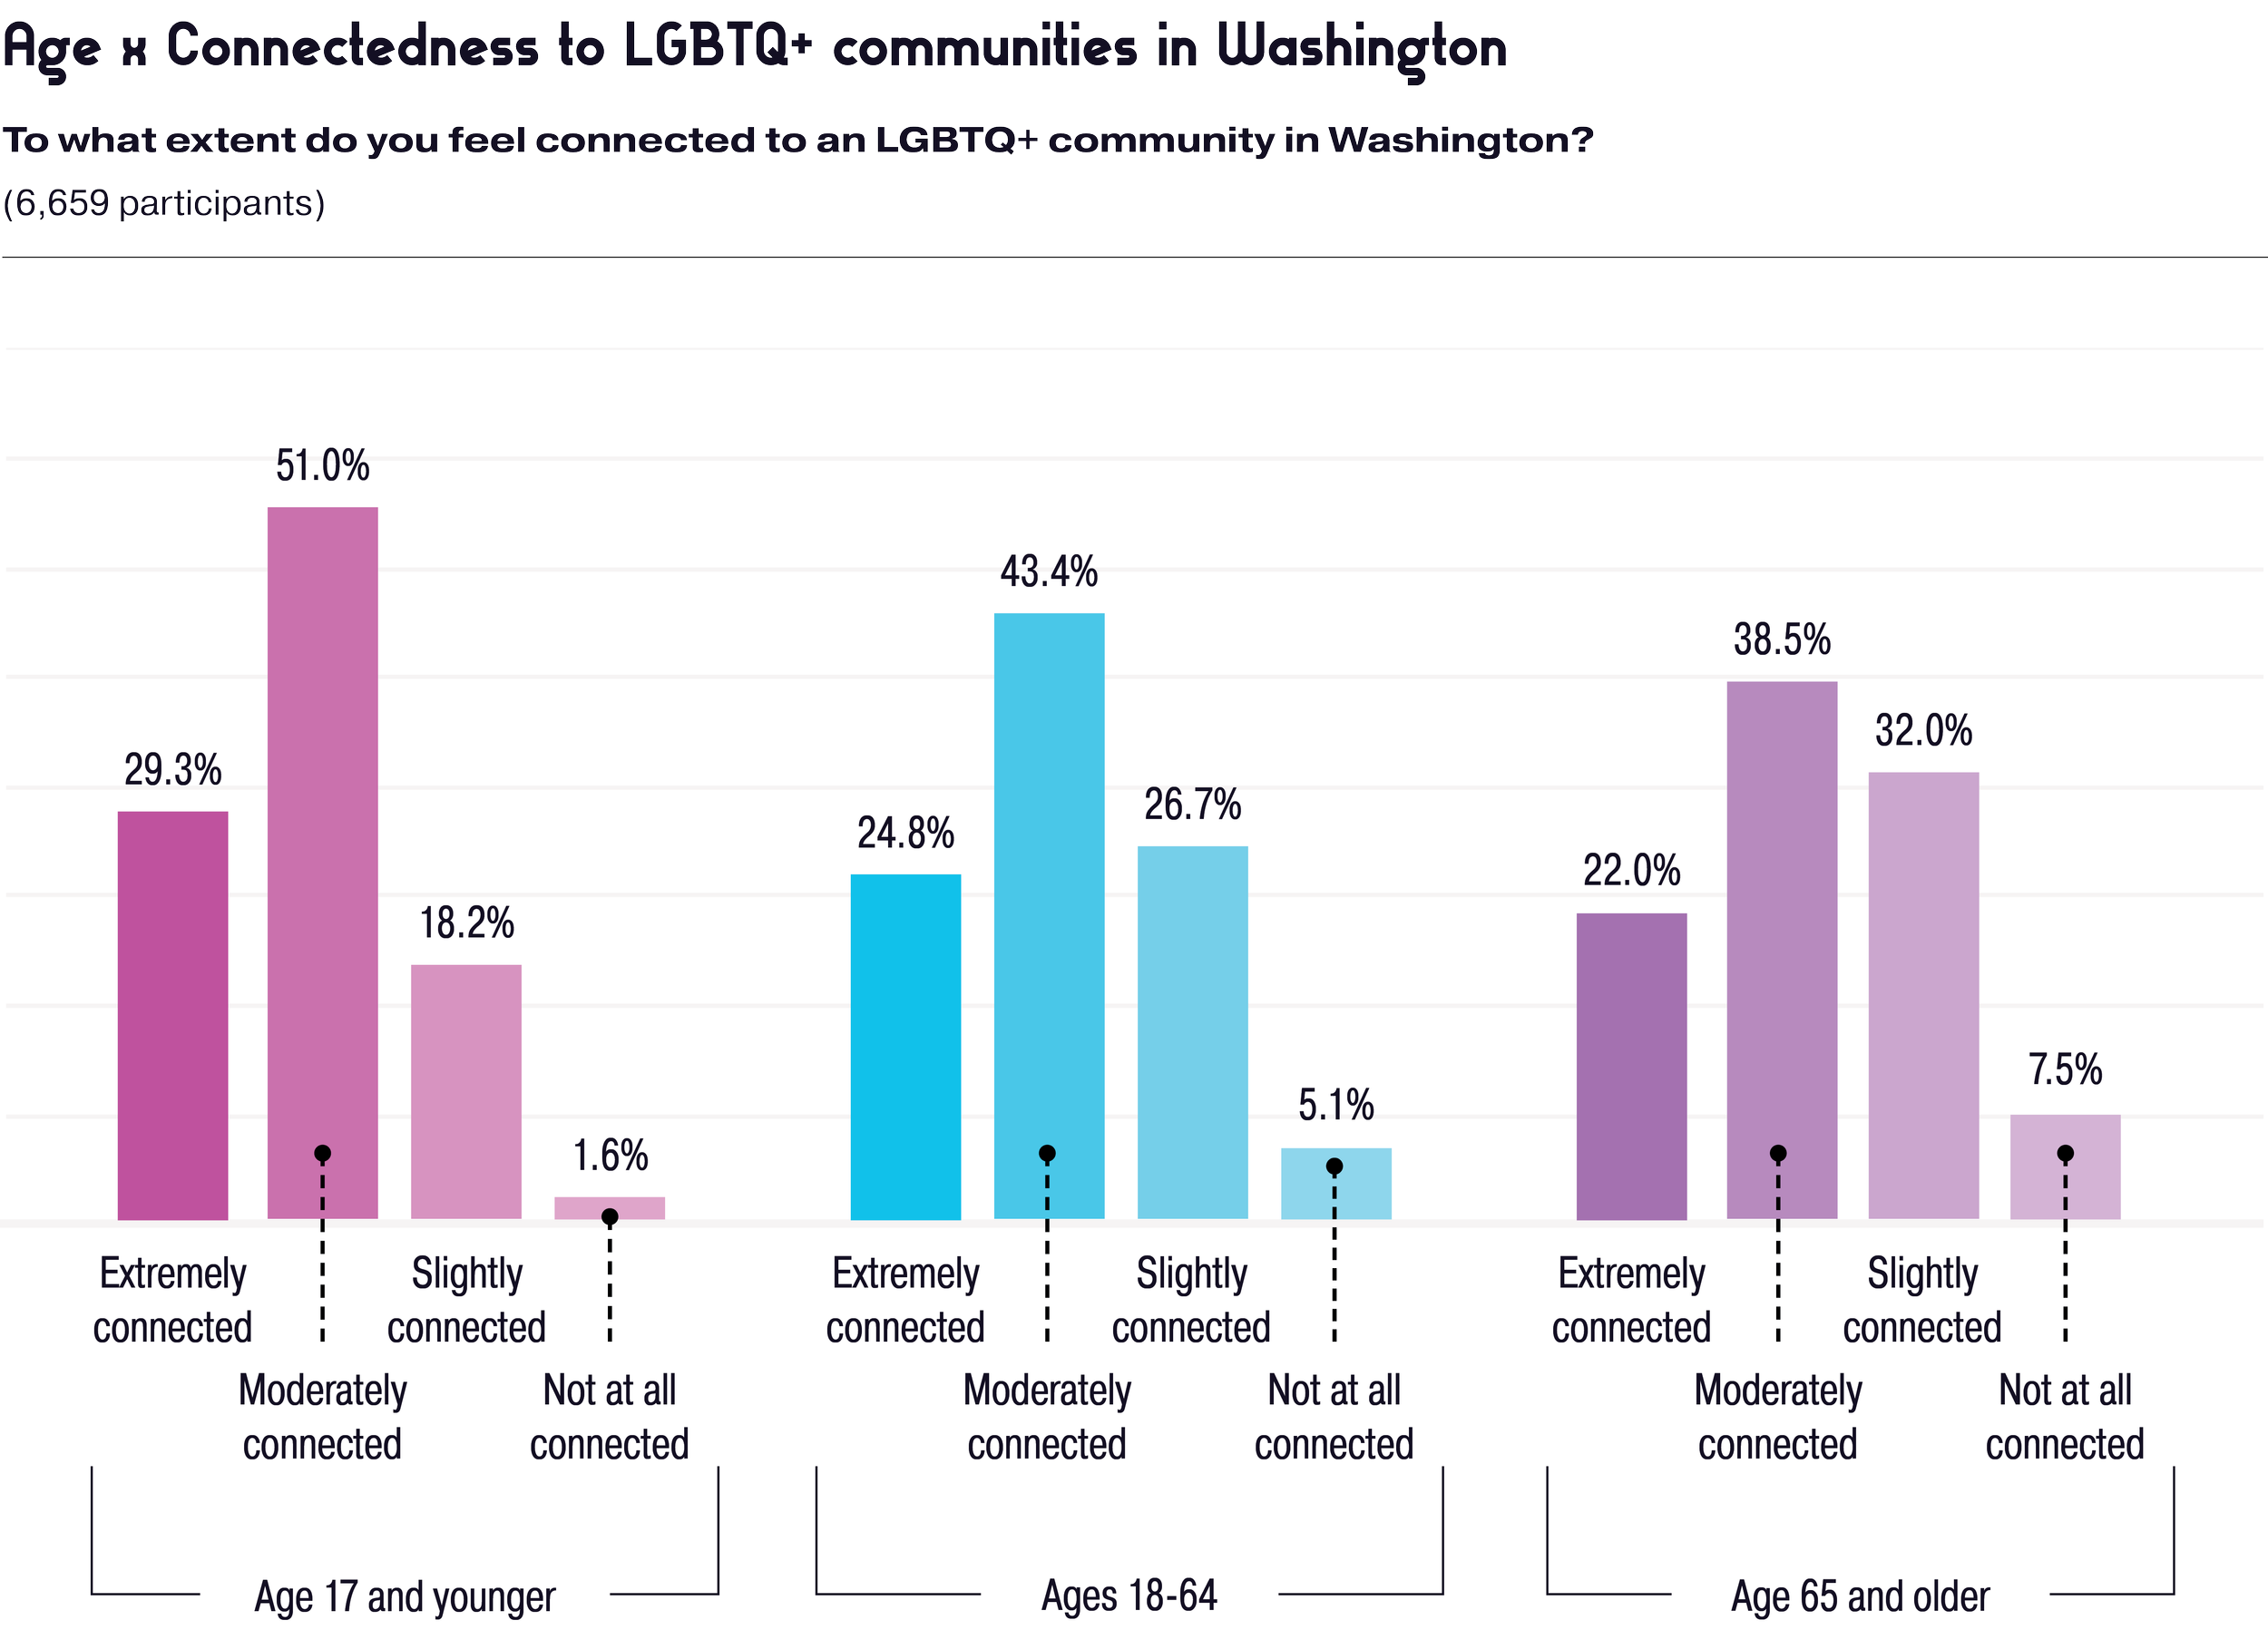
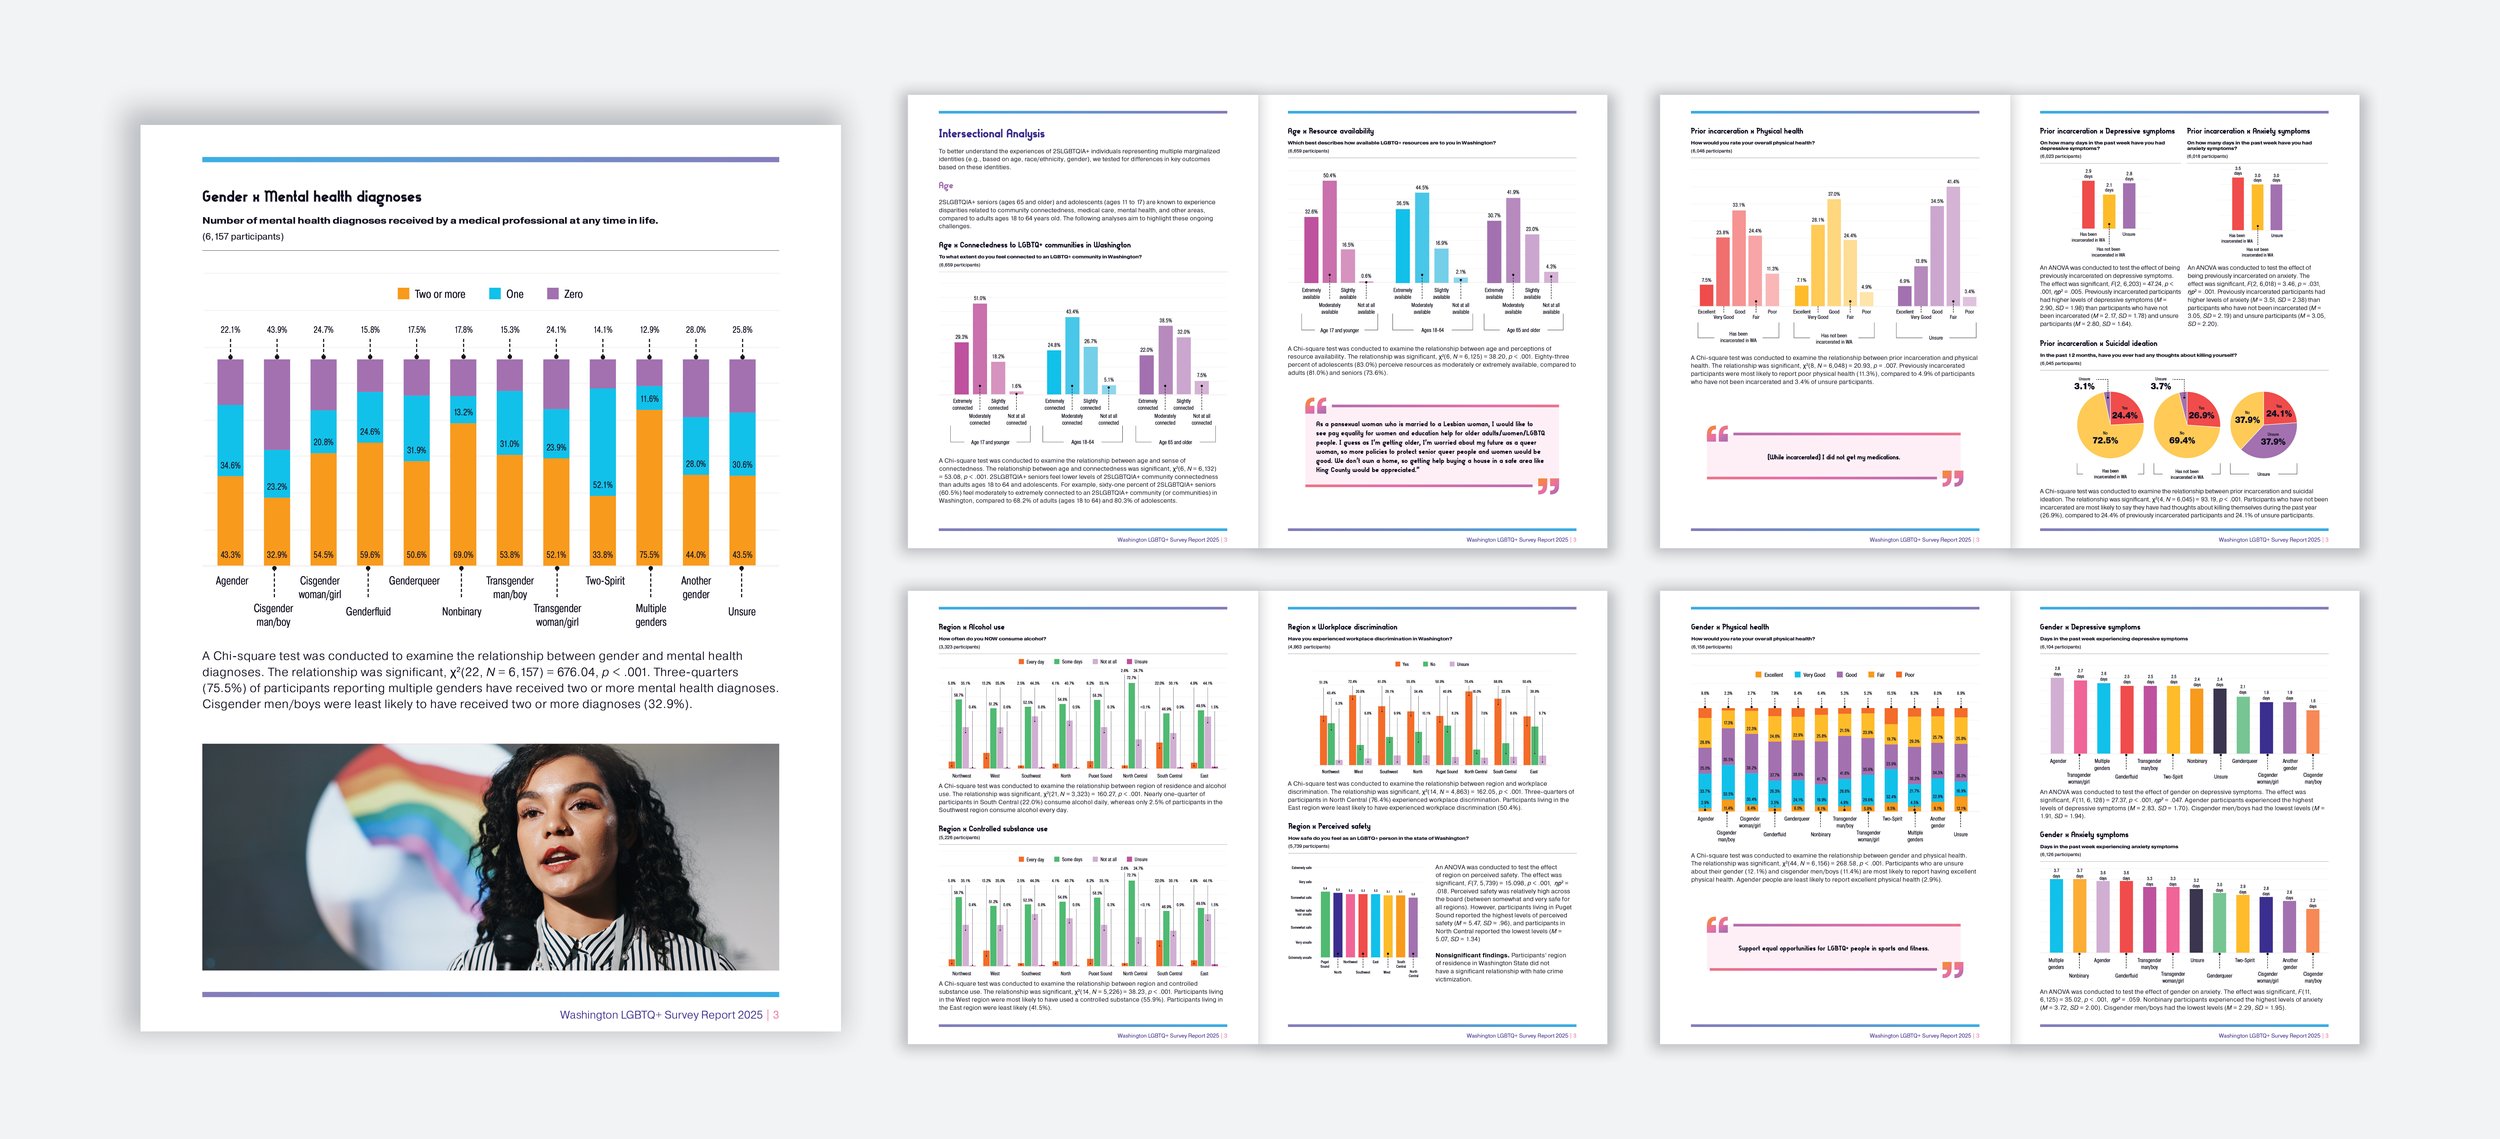
With more than 225 charts and graphs throughout the report, consistency was essential for readability and navigation. The Washington LGBTQ Commission provided an established brand guideline to follow, which I was able to use to developed a flexible data visualization system that established standards for chart selection, typography, color usage, spacing, labeling, legends, and accessibility.
Recurring themes within the survey data informed a modular structure that grouped related information into consistent visual categories. Similar data sets were presented using the same chart types and layouts, allowing readers to recognize patterns quickly without relearning how to interpret each page. This system also streamlined production, making it easier to apply design decisions consistently across the report while maintaining visual clarity and accuracy.
Design System
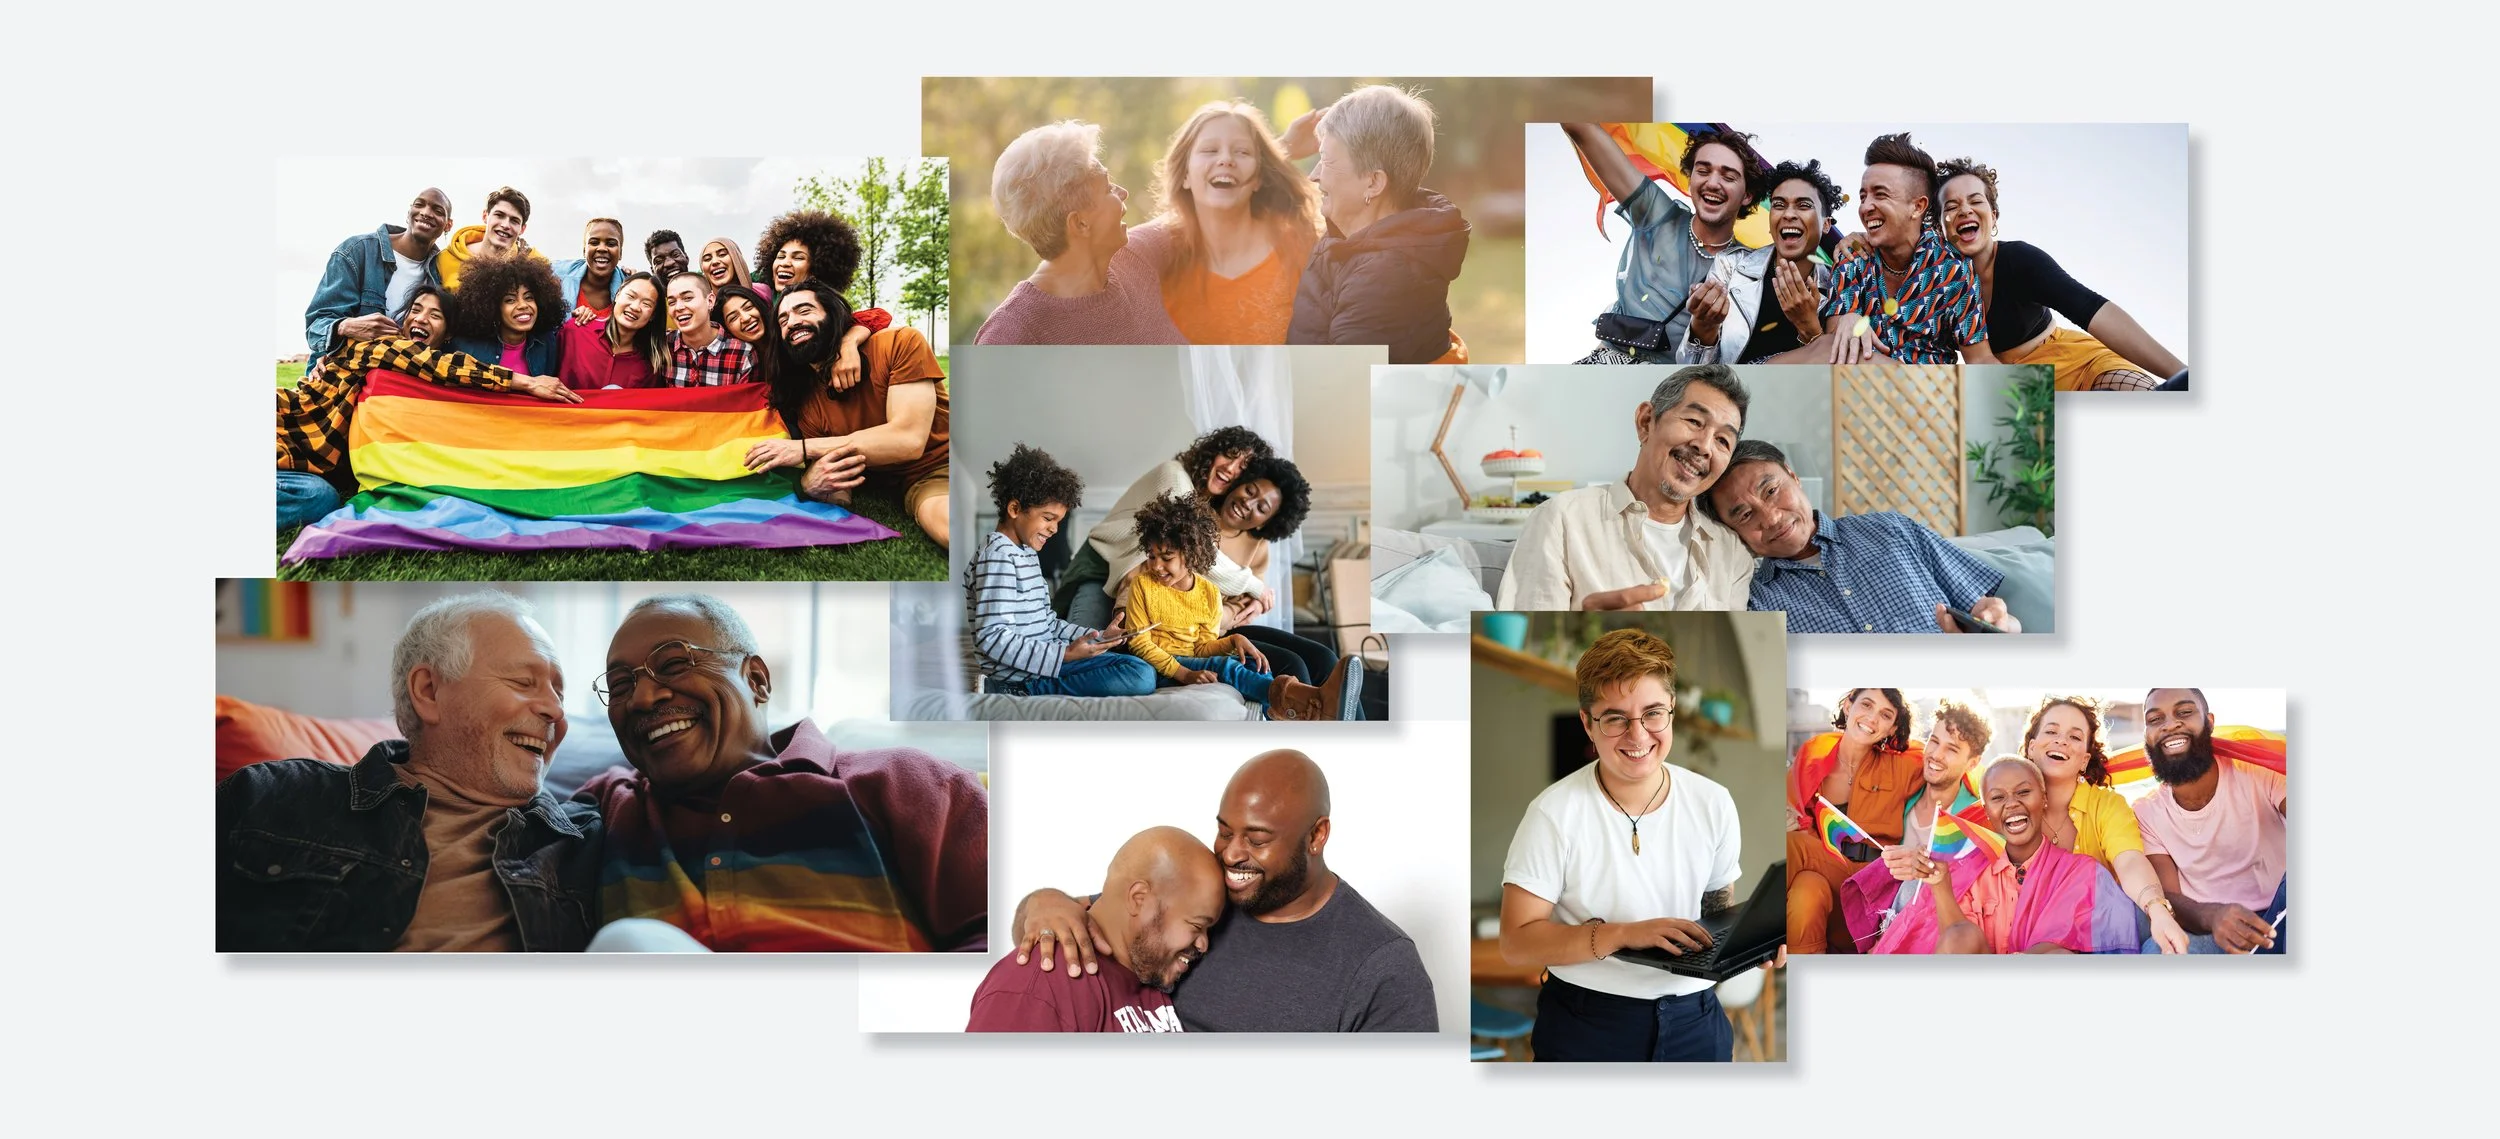
Because the report reflects the experiences of Washington's LGBTQ community, I wanted the photography to accurately represent the people behind the data. I curated imagery that reflected a broad range of ages, races, gender identities, sexual orientations, and lived experiences, ensuring the visuals felt as inclusive as the research itself.
This approach reinforced the report's message while creating a stronger connection between the data and the communities it represents. The imagery wasn't decorative—it was an intentional part of the report's storytelling and overall art direction.
Visual Representation
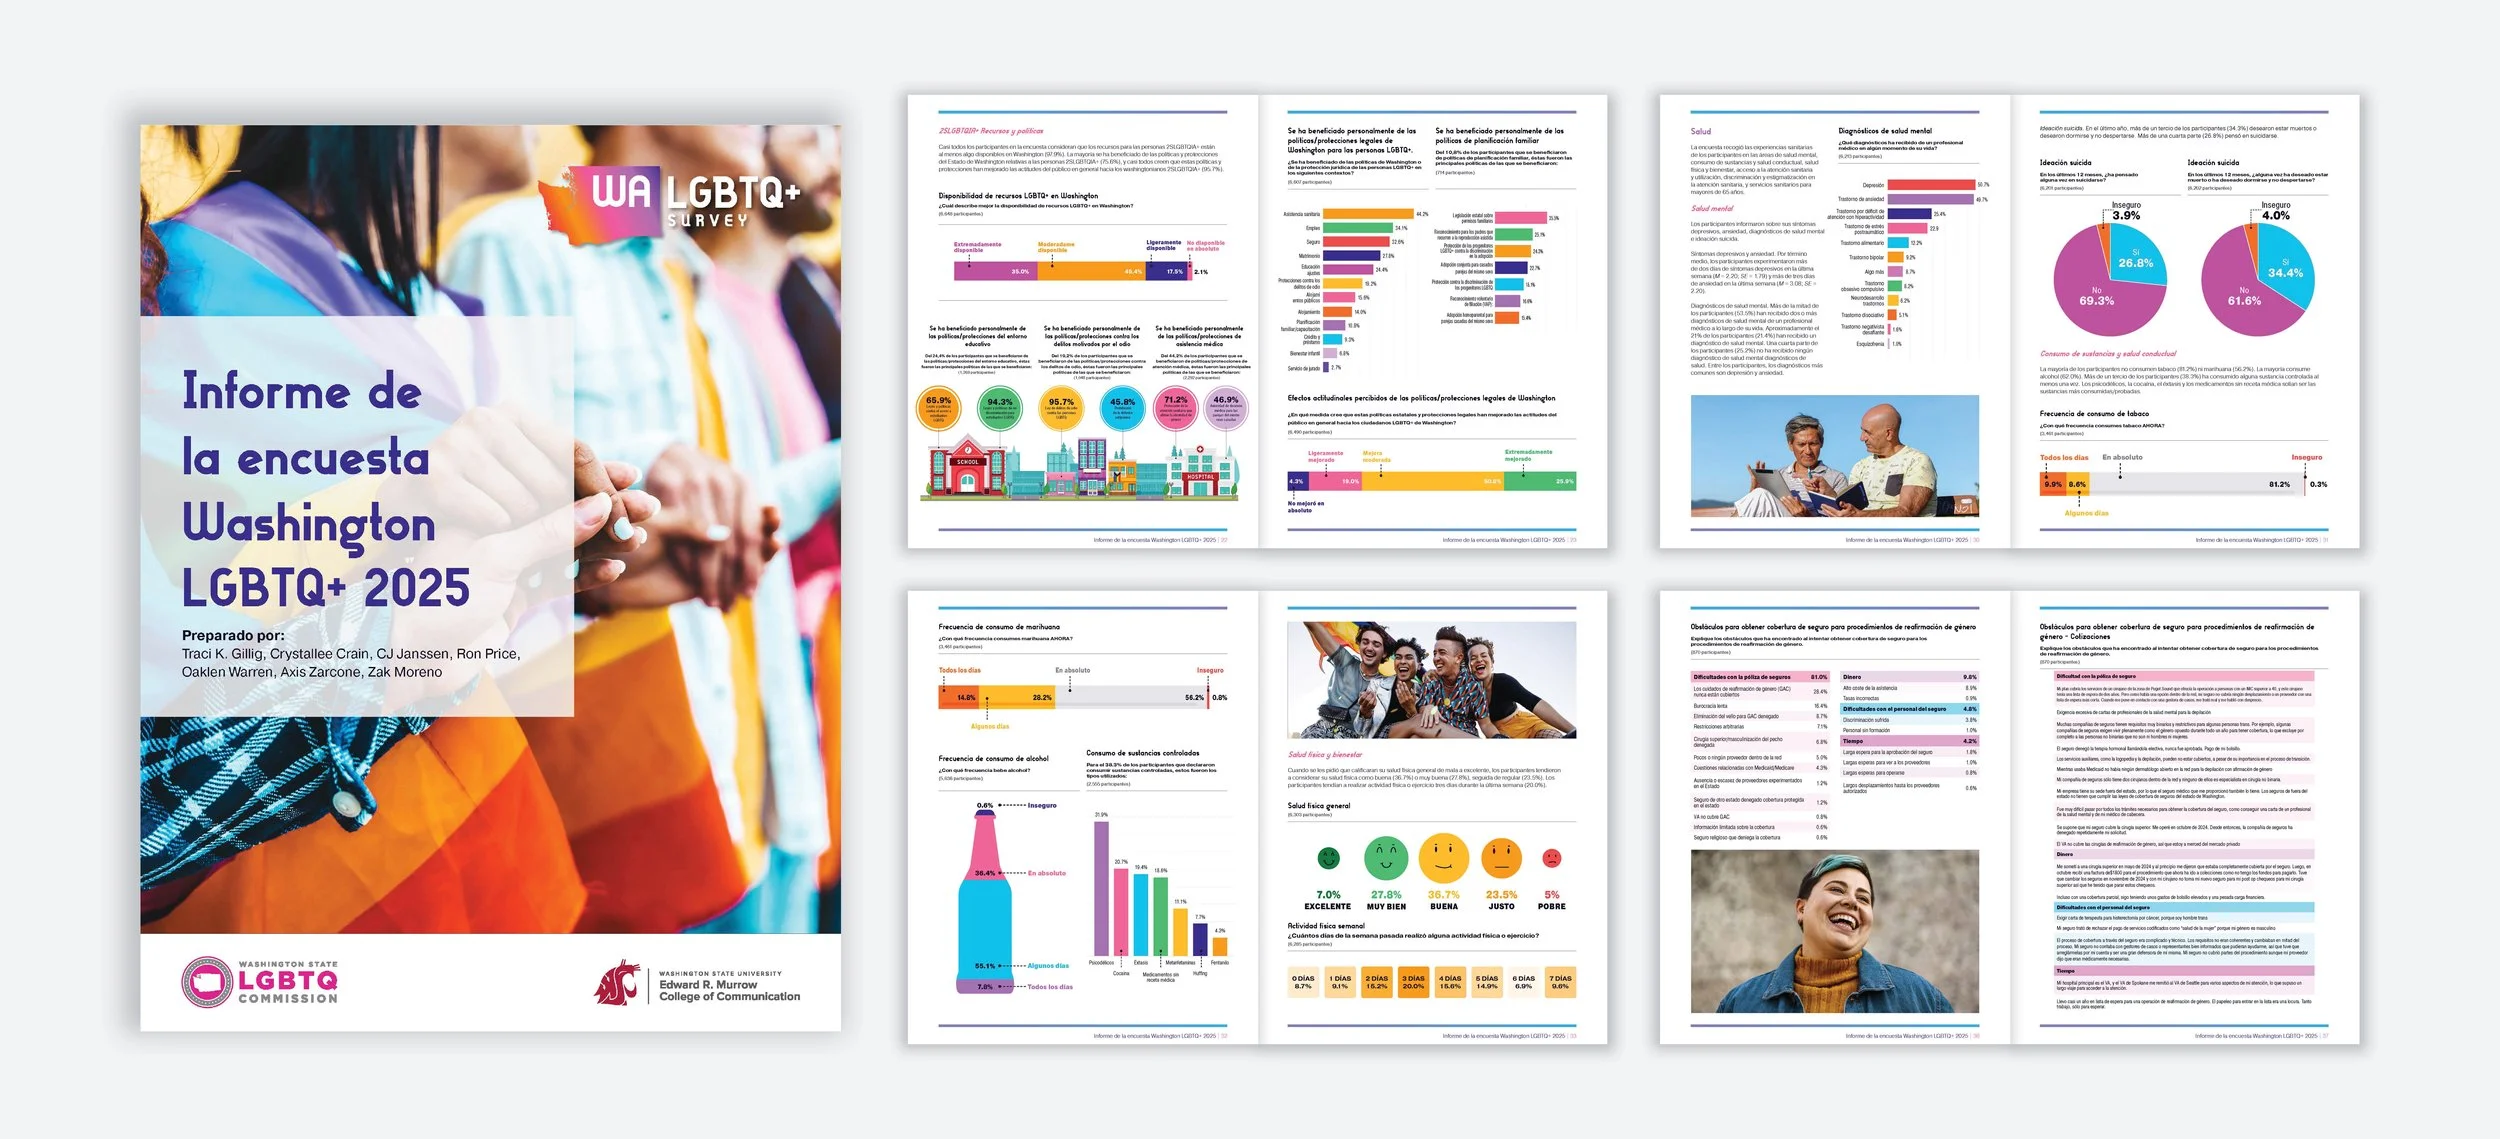
To expand the report's accessibility, I produced Spanish and Simplified Chinese editions alongside the English publication. I leveraged translation technology in collaboration with a professional translator to ensure linguistic accuracy. The process extended beyond translation, requiring thoughtful adaptation of the editorial design to support each language. Layouts, typography, and visual elements were refined to accommodate language-specific differences without compromising readability or design consistency.
Translations
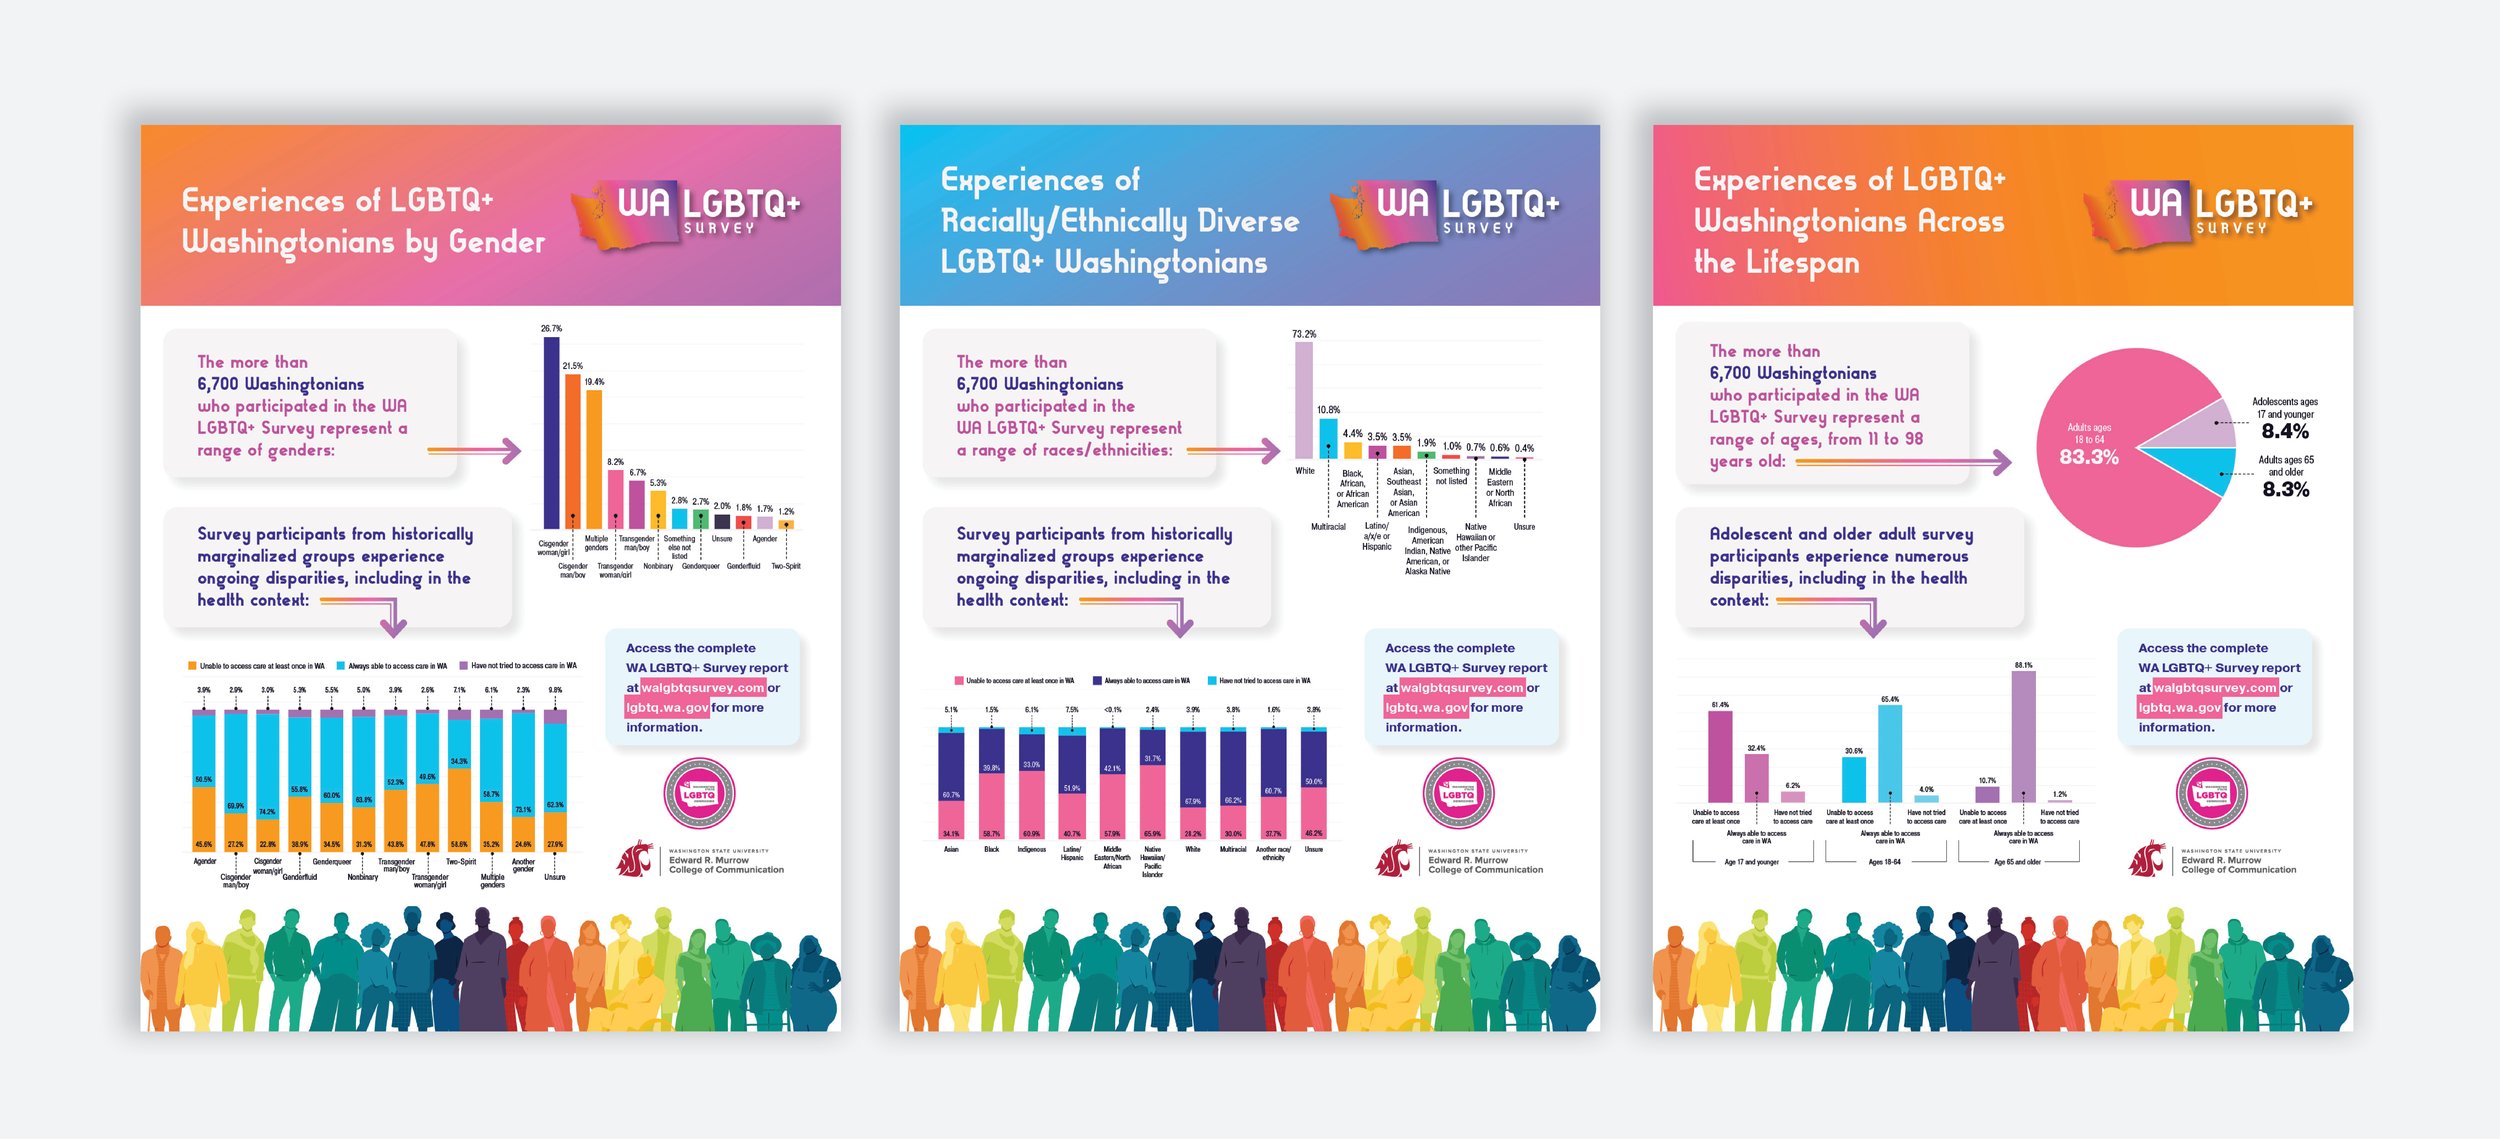
In addition to the full report, the research team requested three one-page infographics to highlight key findings from the study. The goal was to give the audiences an accessible introduction to the research while encouraging them to explore the full report when it was released.
One-pager Infographics
Interested in the full publication? Explore the complete report to see how the data visualizations, editorial design, and research come together to tell the full story.